As part of our AI×CAE activities, we have been investigating and researching surrogate models. We have succeeded in creating a 3D surrogate model, and we report the results here.
・In order to apply the surrogate model by AI to the 3D mesh model, we verified the model with a 3D cantilever beam model.
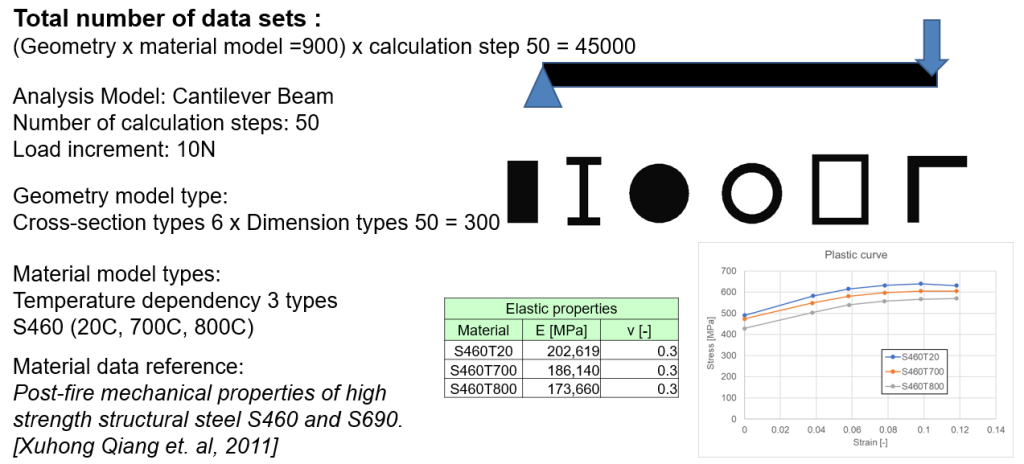
・To train the AI model, a beam model with six different cross section shapes was prepared. For each cross section shape, 50 patterns with different dimensions were prepared, for a total of 300 shape models.
・The analysis was elasto-plastic analysis, and three different material models were prepared. This resulted in a total of 900 model variations (300 shapes x 3 materials = 900).
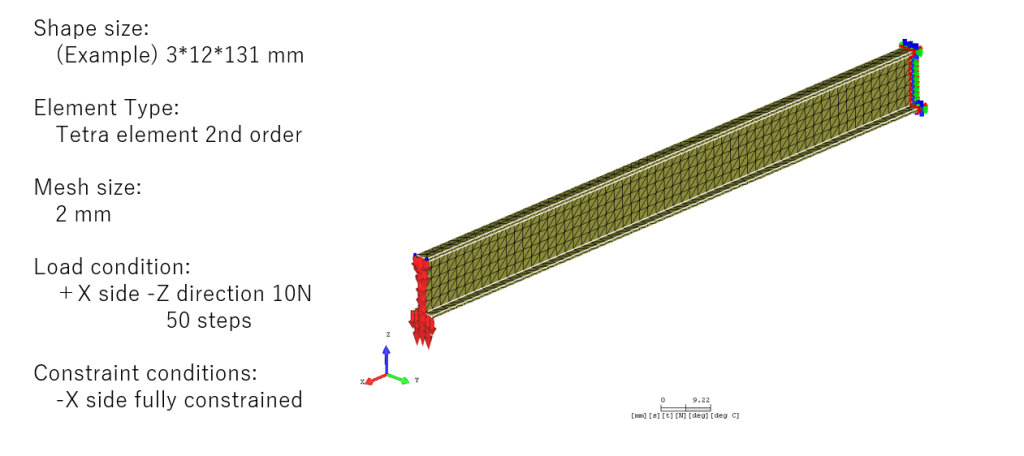
・The boundary condition is fixed as a cantilever beam condition with full restraint at one end and out-of-plane loading at the other end. The load was applied in 50 steps of 10 N per step, for a total load of 500 N.
・The elements used were tetra-second order elements.
・In order to verify the prediction accuracy of the 3D surrogate model by AI, we prepared a validation beam model that was not used for training and compared the FEM calculation results with the surrogate model prediction results.
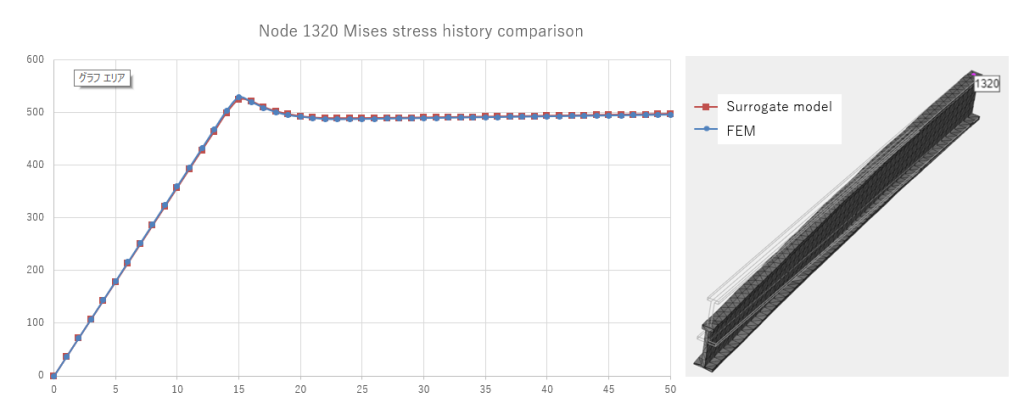
・The Mises stress history of the nodes on the top surface near the constraint point exceeds the yield point and enters the plastic region because of the use of elastic-plastic material. The stress histories of the FEM and surrogate models are almost identical. (See the XY plot image below)
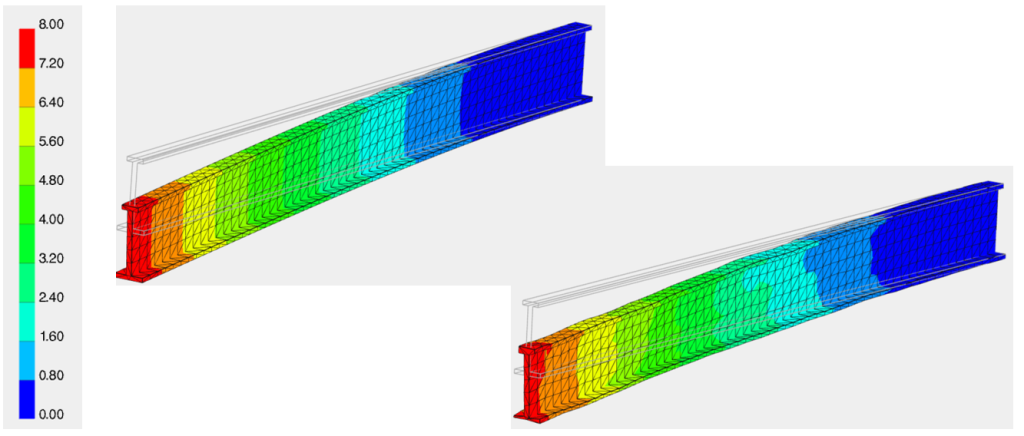
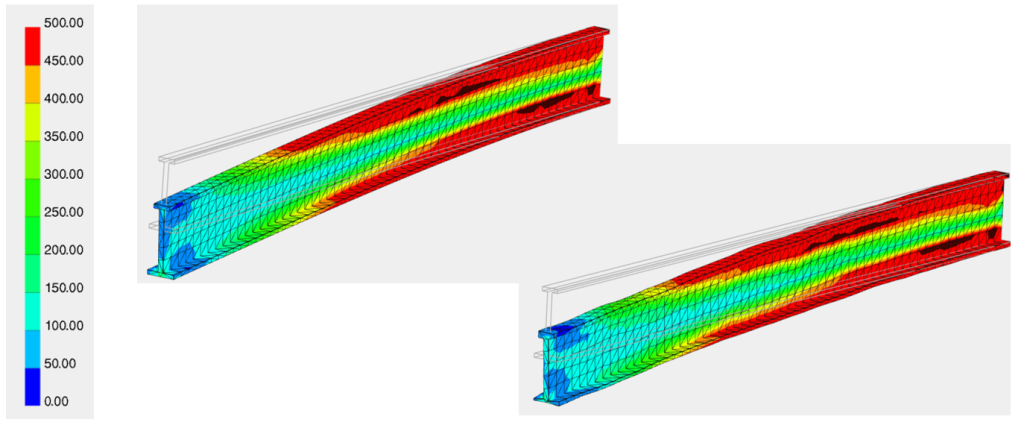
・The distribution of displacements and stresses throughout the model in the final step is in good agreement between the FEM and the surrogate model. (See the contour plot below)
・From the above results, it is concluded that a well-trained 3D surrogate model can track the elastic-plastic behavior well.
・A large difference in computation time was observed, a few minutes for FEM analysis and a few seconds for the surrogate model.
A comparison of the Mises stress is shown below. There are two figures, the upper figure is the result of FEM analysis and the lower figure is the result of AI model.
A comparison of displacement is shown below. The upper figure is the result of FEM analysis and the lower figure is the result of AI model.